The impact
With now over five years of experience working with the rural communities of Uganda, we have seen how access to clean and safe water transforms everything.
225,000 +
People reached with proper sanitation + hygiene and access to safe water through SODIS, motorised boreholes & rain water collection tanks
Through partnership with district local governments and the different leadership structures such as VHTs (Village Health Teams) we are able to reach every single person and bring change.
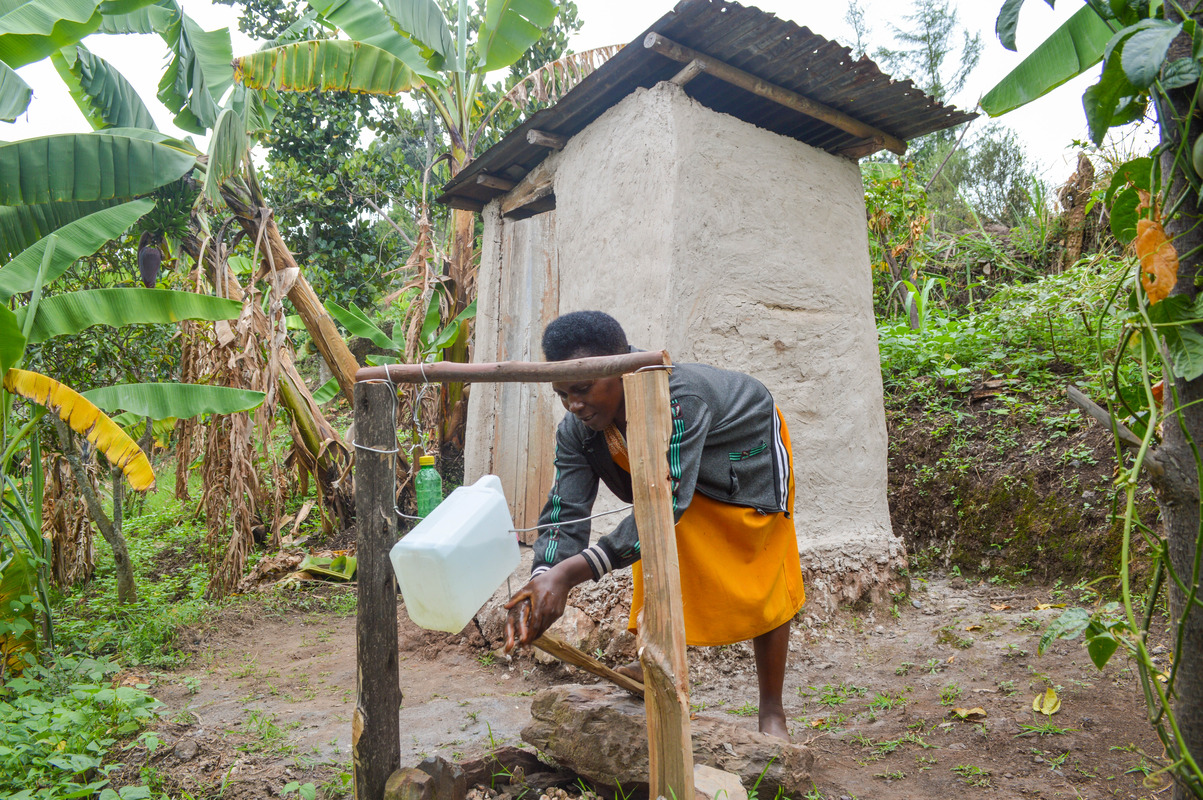
700,000
People have been trained and equipped in sanitation and hygiene
12,500
People have been reached by 7 motorised boreholes bringing water closer
$100,000
has been saved by AWS VSLAs in over 4 years
1,087
Rain water collection tanks constructed bring water to more than 1,000 people
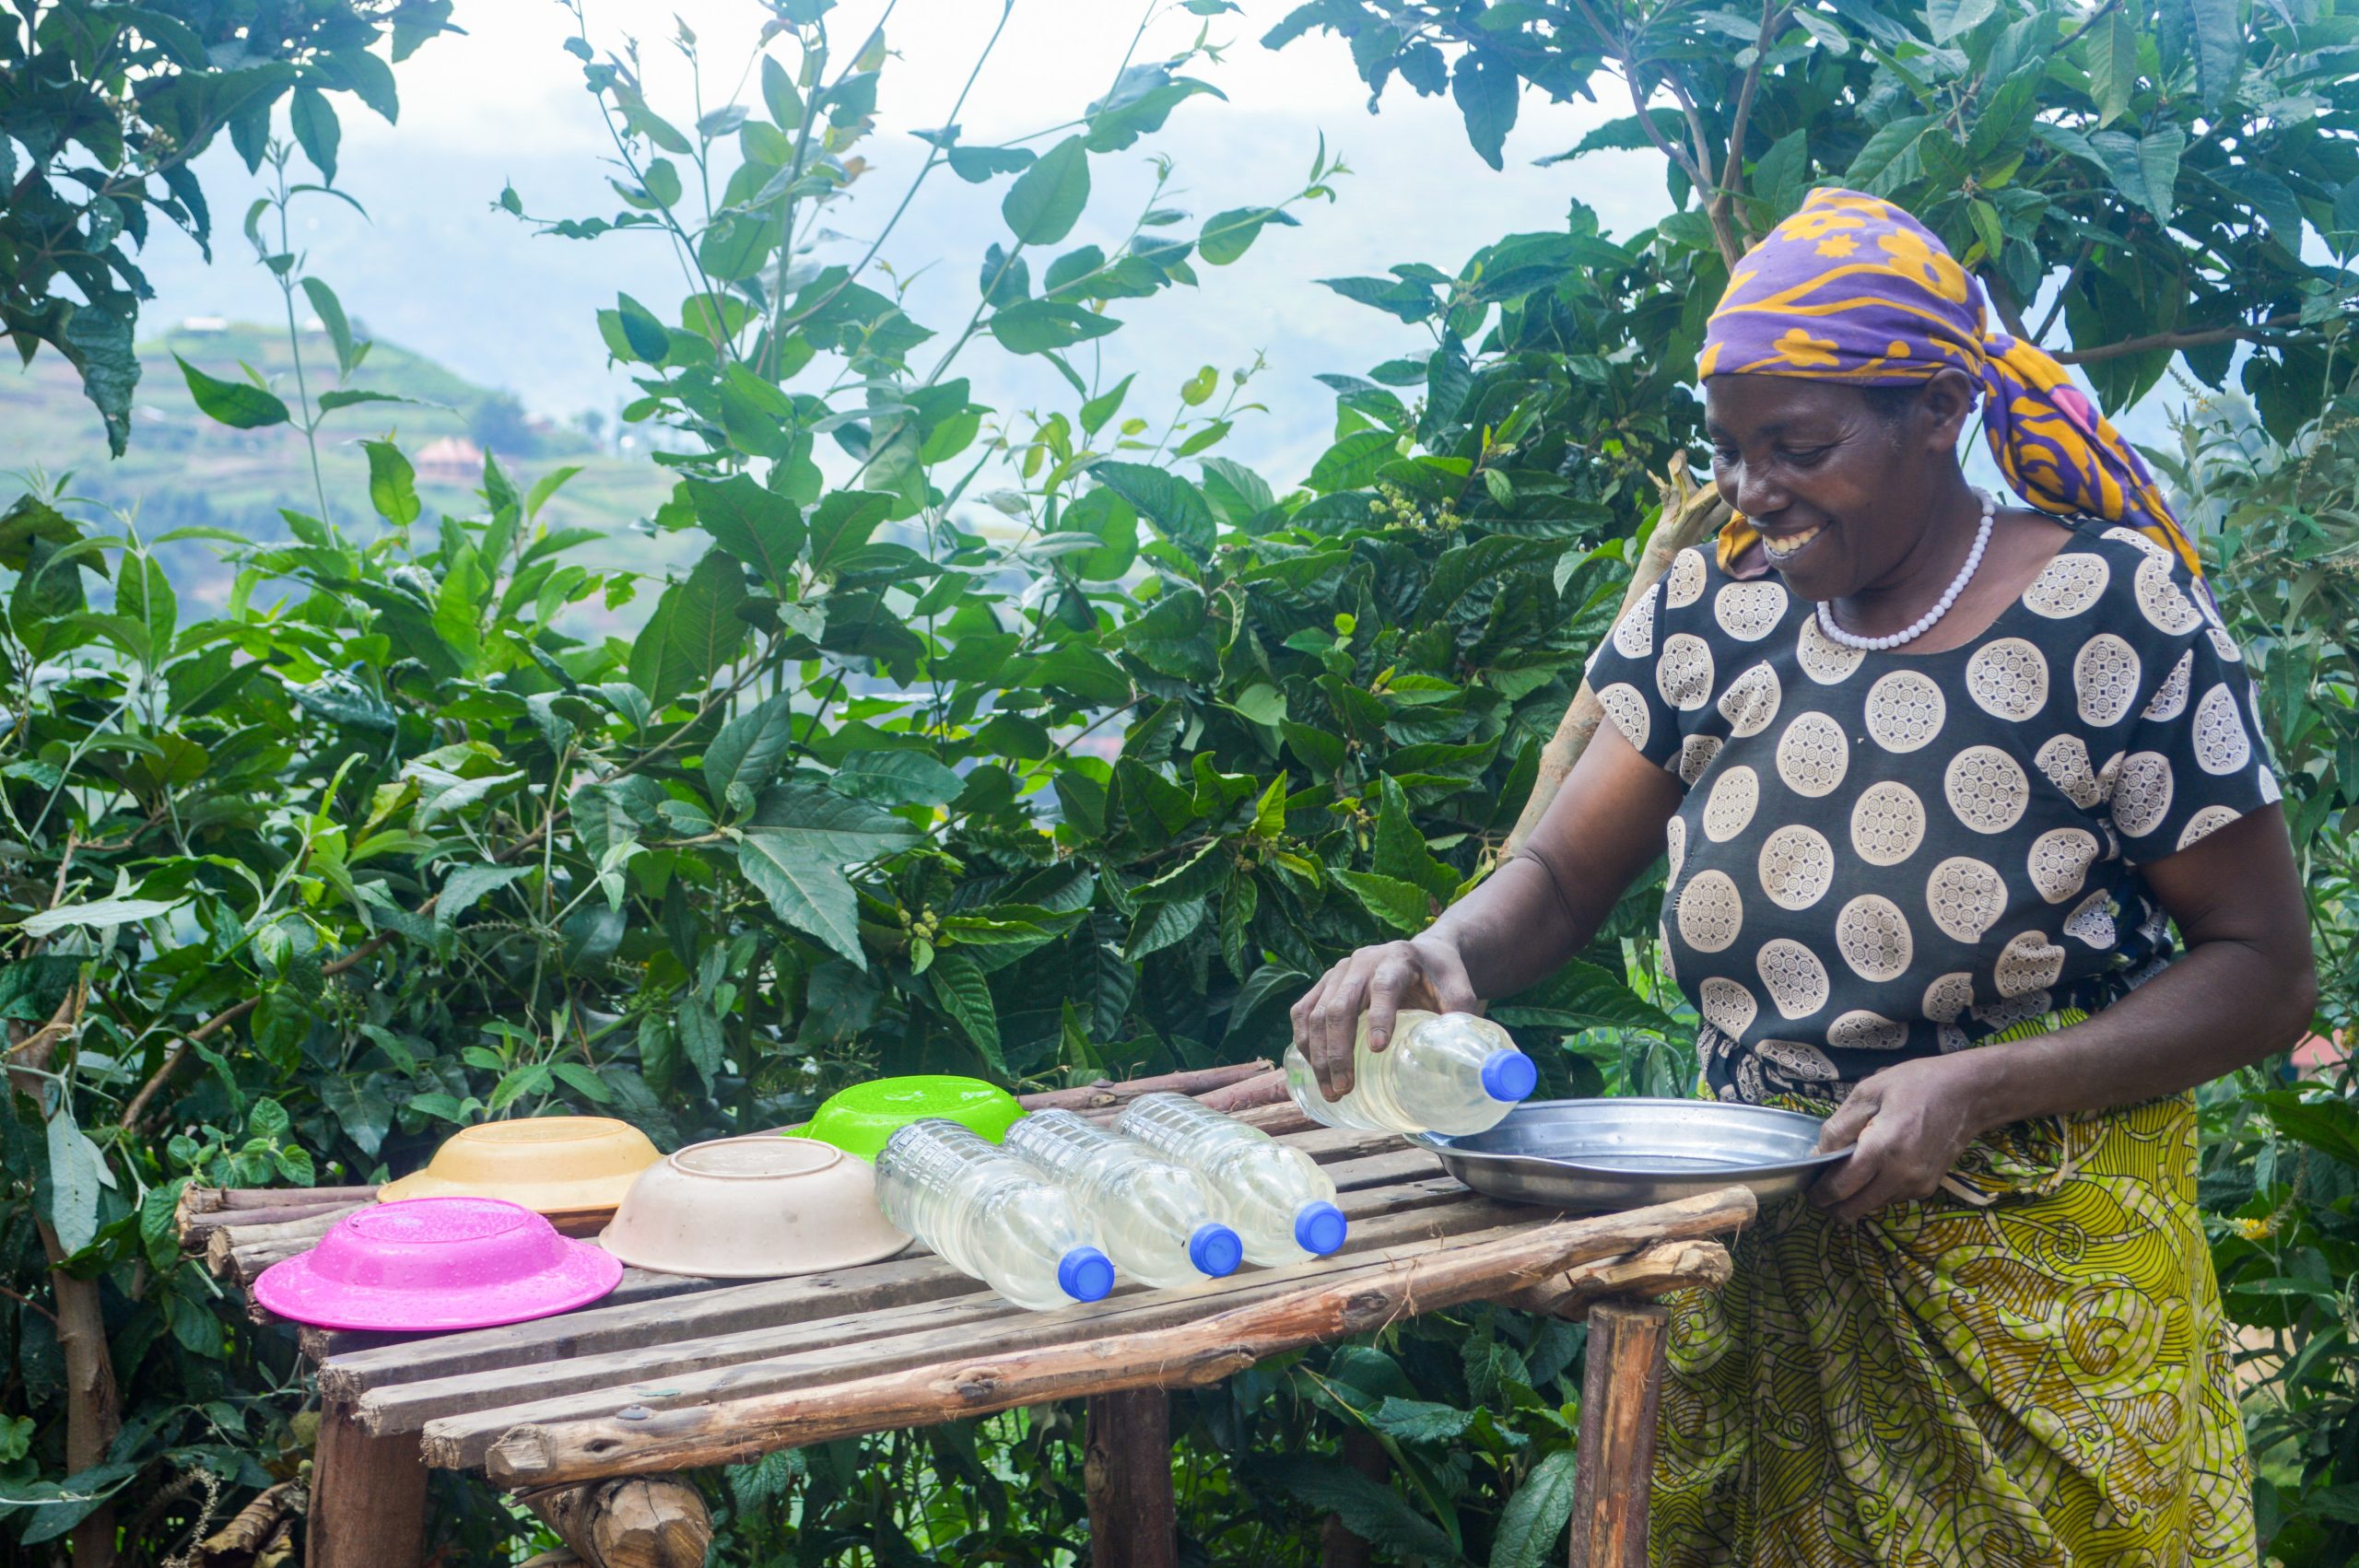
700,000
People are accessing safe water through SODIS
17,000
Schools have been trained in making reusable pads
How we measure our impact
The Major indicator for program impact measurement is the number of diarrhoea cases reported by the beneficiaries across the baseline and monitoring periods. This data is compared to that from the Ministry of Health DHIS 2.
THE AWS MOBILE DATA KIT
The ODK (Open Data Kit).app is the primary AWS data collection tool. The app contains forms that are utilised to collect information from beneficiaries at baseline and monitoring levels. Data collected is reflected on a dashboard where it is sorted, analysed and visualised by the Monitoring and Evaluation. Through our data collection app, we are able to track the changes as they happen in communities.
HEALTH DATA FROM DHIS2
Before we collect our own data, we benchmark with health centres to inform the need for our intervention. We carry out own baseline studies in these areas and then start training. We use health data from health centres as a yard-stick to compare and check the credibility of our data and measure our impact to see the difference we make in the communities.
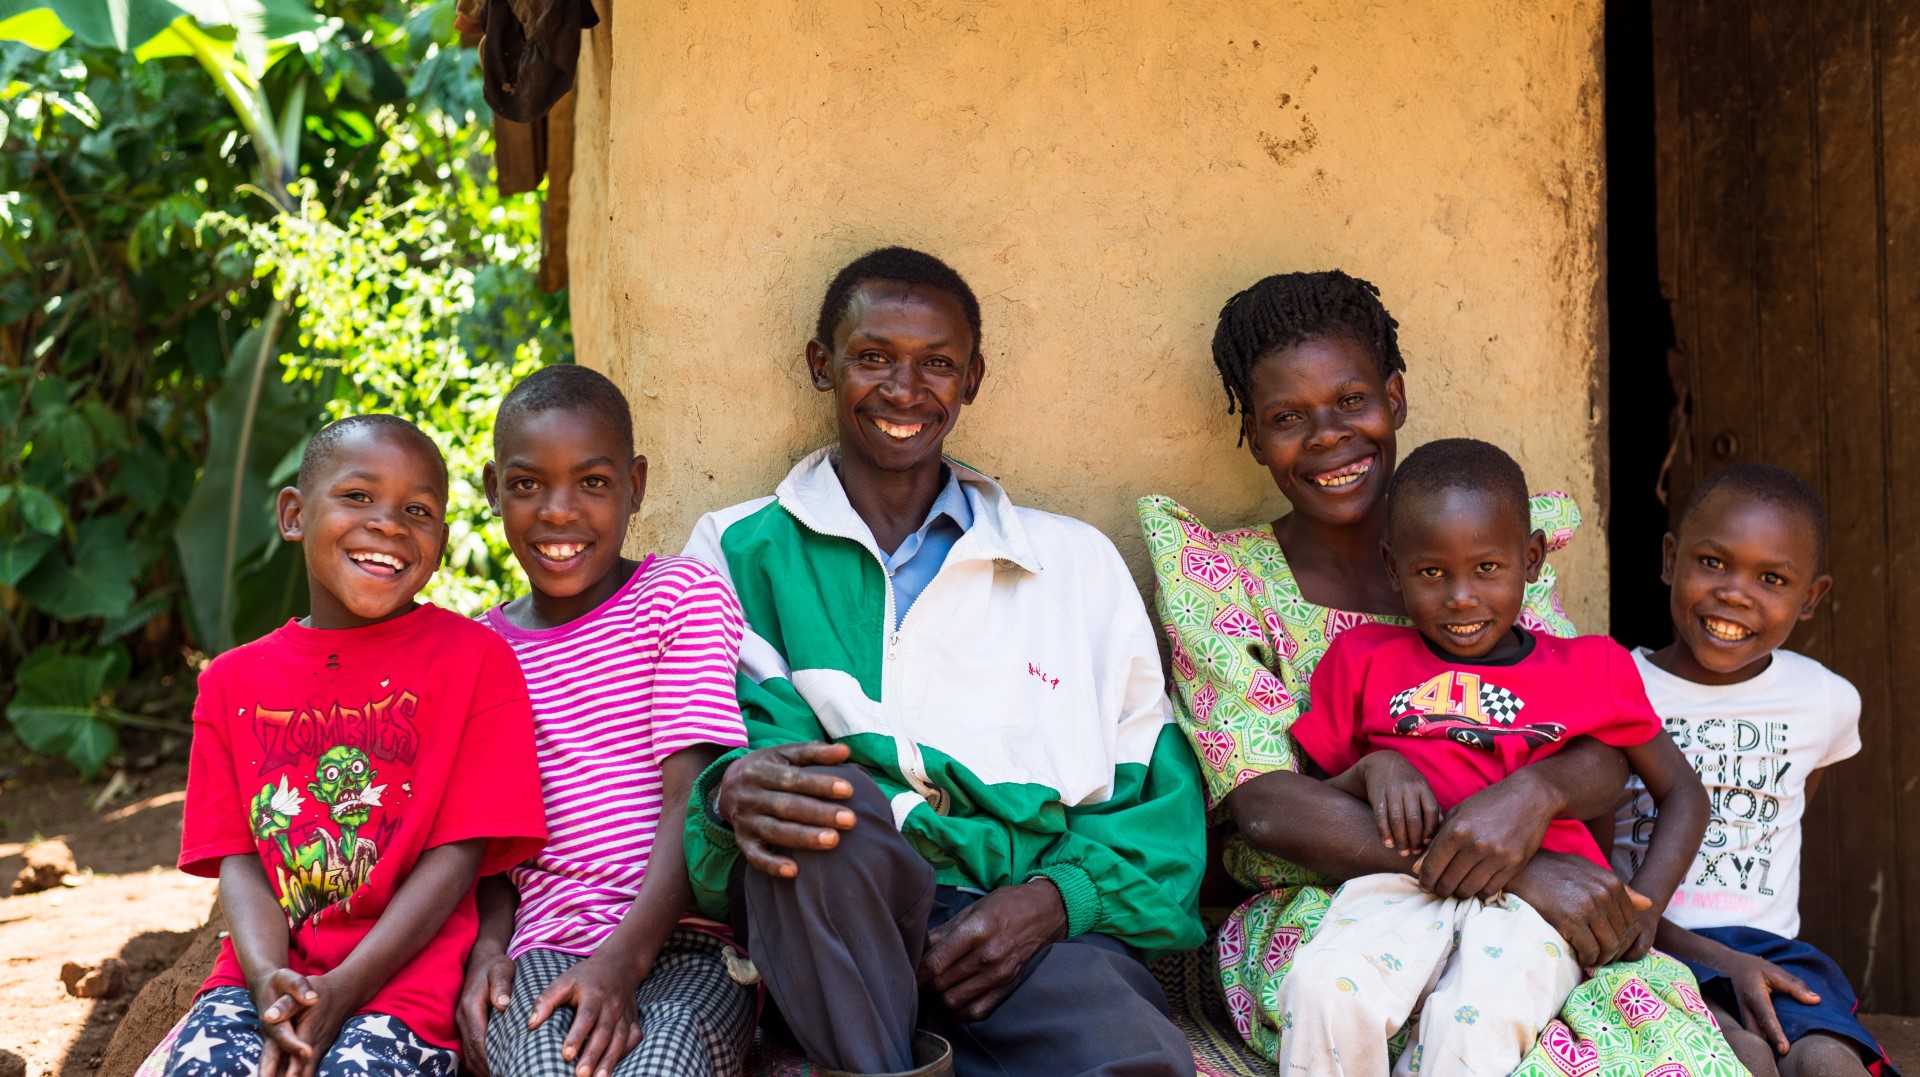
WE SEE THE IMPACT PHYSICALLY
At the end of our intervention, we see a difference from the point of baseline and at monitoring. Majority of homes will have clean compounds, hand washing facilities and latrines. Homes are cleaner, people have better self esteem due to improved hygiene, children are happier because they are not suffering from diseases any more. After our intervention, we see happier communities.
This is what our partners say about our work in communities
See the impact of clean water
Read inspiring stories from our beneficiaries